Mapping data helps identify future wildfire risk

 Ordnance Survey
Britain's mapping service is providing data for government, emergency services and businesses that could help predict the risk of future wildfires.
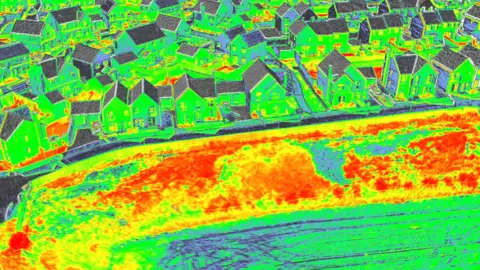
By analysing information gathered by drones, aircraft and satellites Ordnance Survey (OS) says it is offering a clearer understanding of where and how climate impacts are taking place and how to mitigate those risks.
"You can see, is somewhere liable to flooding, is somewhere liable to wildfires, for example", says Simon Navin, Head of Geospatial Services at OS.
"It can give anybody who is making those kind of choices and those kind of decisions hopefully the right tools and the right information to make a more informed choice," he adds.
 Ordnance Survey
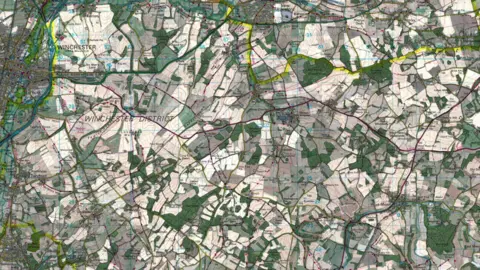
OS is responsible for maintaining the national geographic database, providing accurate up-to-date mapping to support both the private and public sectors.
In the past the majority of the data it used to create its maps would be gathered manually, sending staff out to carry out its research.
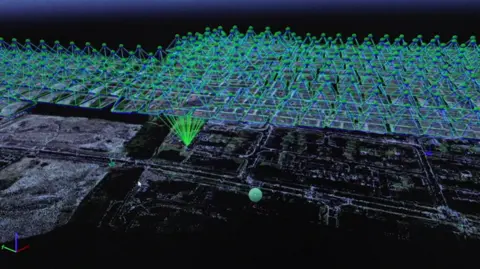
It now has a drone team of 21 pilots across the country working alongside aeroplanes and 200 field surveyors.
It will check on new housing developments and major changes to infrastructure every two months during construction.
"We get up to 2cm accuracy on our mapping", says head drone pilot James Morrison.
"It's very important that we visit these sites regularly because we need to give the information to emergency services who might need to know the quickest route to a particular house," he adds.
 Ordnance Survey
When firefighters were called to tackle the New Forest wildfire on 9 August they were able to use OS mapping data to plan their route, down to checking if gates were wide enough for vehicles to pass through.
But the ability to help plan for the long-term by identifying areas most likely to be affected by the impacts of climate change is becoming an increasingly important part of the agency's work.
Analysis has found that more than 1.8m homes are located within 100 metres of urban boundaries, where in recent years the greatest proportion of fires have taken place.
Emergency services are able to use data to decide where to place their resources, create fire plans, coordinate teams and identify at-risk homes accurately.
OS also monitors extreme heat, subsidence, winter flooding and coastal erosion.

"Particularly this year we've seen some fairly extreme weather conditions," says Navin.
He adds: "Extended periods of drought create additional risks around wildfires.
"The information that we have, knowing about what a building might be made of, how it's constructed, where it is in relation to water-courses - coming together with that additional information about how the future might change brings you to a place where you have to make different choices."